ShareVault Releases Version 4.2 with Updated Reports Pages
11 October, 2019We're thrilled to announce the release of ShareVault version 4.2 on October 9th with new reports pages with improved analytics capabilities including enhanced charting and automatic scheduled emailing of pre-configured reports, based on input from our customers in investment banking, life sciences, legal and other professional sectors.
Updated Look and Functionality
The Reports pages have a bold new look compatible with the look of the other ShareVault pages. The pages automatically adapt to provide an optimal layout based on the size of your screen, and provide tooltips and drilldown functionality so you can click to see what underlies the trends that you observe. The interactivity and configurability of the reports have been enhanced so that you can customize the reports based on your requirements - you can drag the panes and resize columns based on your needs. Graphical charts have been added to provide improved visualization of user activity. As before, the reports are interactive and configurable, and now you can save and recall the settings of both the Activity Summary and Activity List reports so that you can instantly run your favorite reports.
Updated Activity Summary Report
The Activity Summary Report provides an overview of the activity of each of your groups across all documents. You can expand the tags (folders) to see breakdowns of user activity on a per-tag basis, or filter to show activity for a particular timeframe.
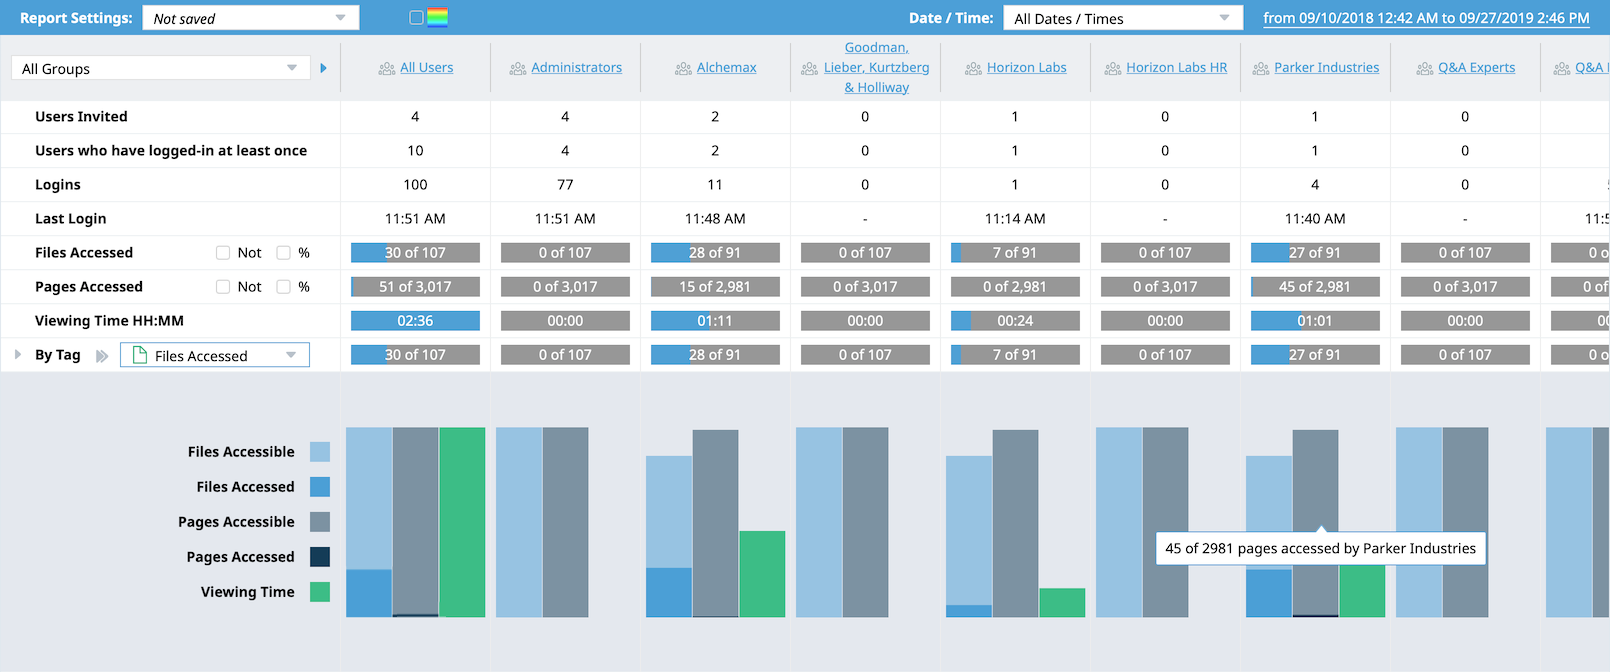
The bar chart below the data table allows you to immediately spot the most active groups, with tooltips that give the numbers behind the bars. The heatmap feature provides an additional visualization tool that helps to identify hotspots of user activity across the tags in your ShareVault. You can click a group to drill-down into user-level activity.
Updated Activity List Report
The Activity List report gives you a detailed audit trail of user activity in your ShareVault. You can filter the activity by date/time, activity, group, user or tag. The filtered activity is presented both on a graphical timeline and as a scrollable list of events, with detailed metrics including which specific pages were viewed and how much time was spent actively reading.
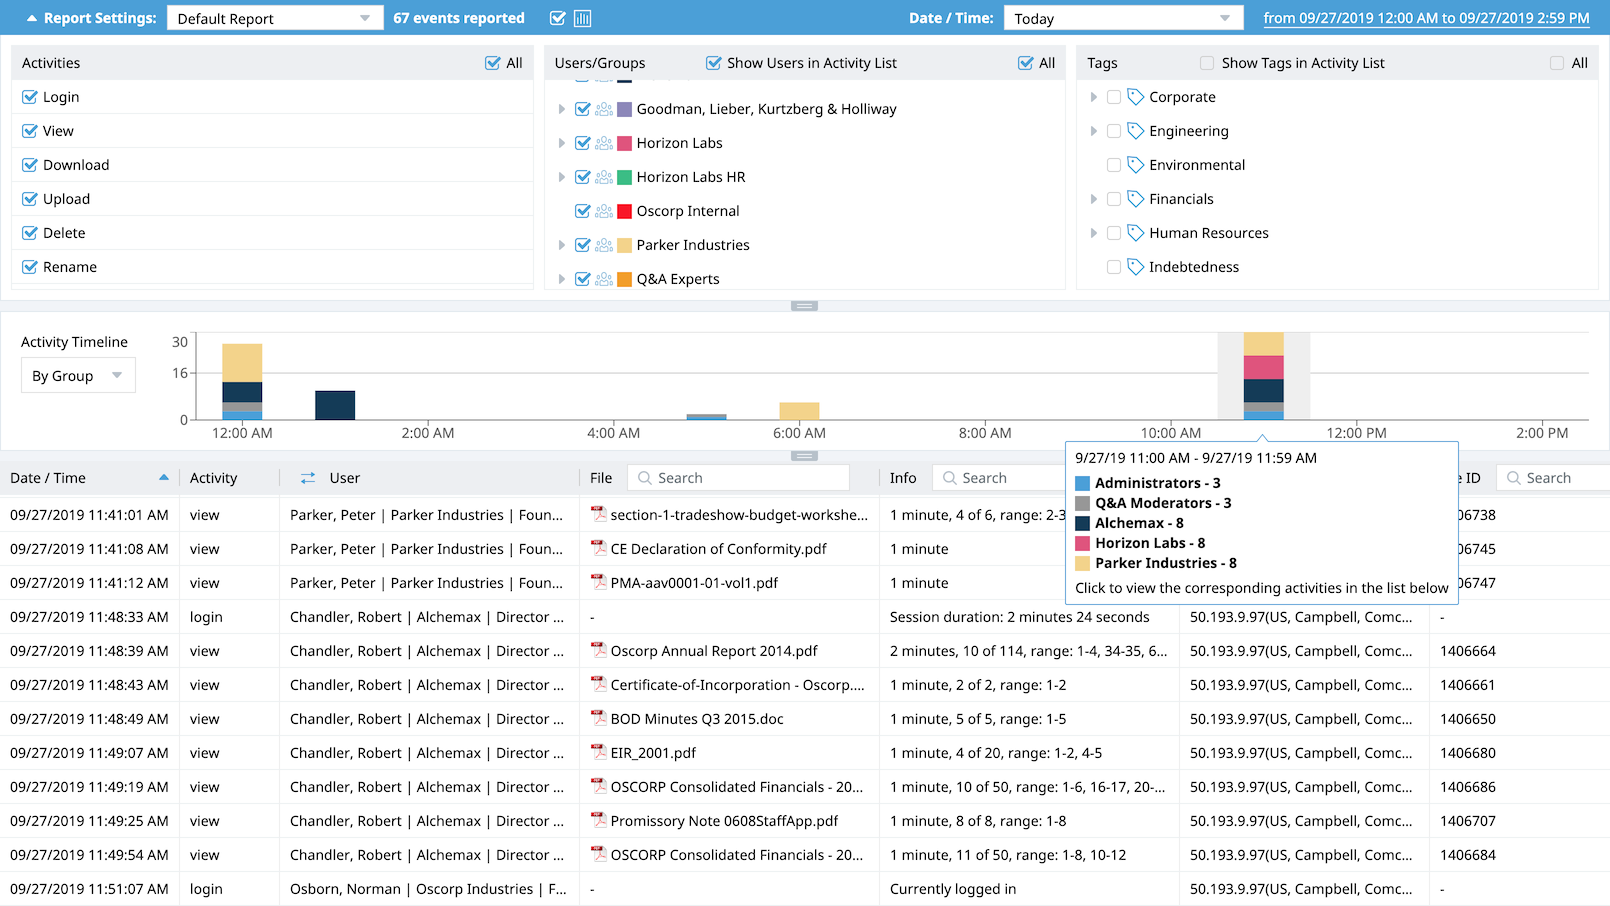
The timeline can be configured to display activity by group, by activity or by tag. Tooltips on the stacked bars show the breakdown of the counts. Click a bar to scroll to the corresponding events in the list below. The list can be further filtered by typing into the column headers.
Automated Scheduled Emailing of Reports
In addition to the ability to print or export your report to Excel, ShareVault now allows you to configure a report to be run on a schedule (daily, weekly, monthly, etc.). The resulting report will be automatically emailed to your users according to the schedule that you choose.
Leaders in Sharing Analytics
These updates give you enhanced analytics to better understand the relative level of interest of each of the users groups reviewing your documents, and to gain improved insight into specifically which types of content are of interest to each of the parties in your ShareVault.